LAST MONTH
NEXT WEEK
TOP
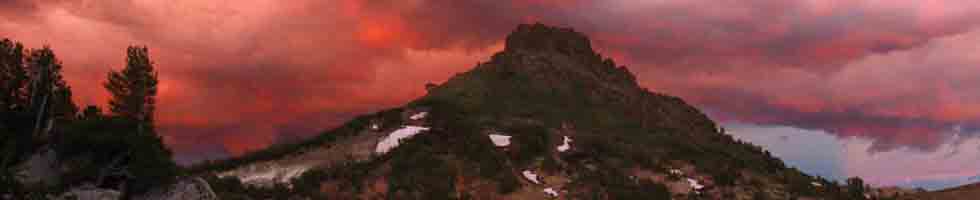
PRECAUTIONS AND OPPORTUNITY
Some backpackers are observing patterns and trajectory of Winter storms and temps to find Hiking Windows into the
Winter Wonderland.
Others are watching the snow activity/pack to determine when the trails will clear enough to begin their Pacific Crest Trail or John Muir Trail backpacking trips.
2020
?
Cold, with
Virtually No Precip During February 2020
2019
FULL WINTER CONDITIONS
FEBURARY 1
2019
NORMAL-AVERAGE WINTER
SNOW
Potentially
Indicating
a
LATE STARTING SPRING SEASON
for
PCT & JMT HIKERS
So Far...
2018
FULL WINTER CONDITIONS
2018:
WINTER
COLD
The Fall Gear has long been stowed or complimented by the heavy Gear of Winter.
What's Going On?
See
November 28 of 2017 Report:
FULL WINTER GEAR REQUIRED
WINTER of 2018
2018 UPDATE
Weak Snows on the Mountains!
All
High Sierra Weather Info
Latest Daily Snow Depth Summary
Daily Sierra Snowpack % of Normal pdf
Daily Snow-Water & Percent of Average
All Precipitation-Snow Data
All Snow Surveys
SWC & Snow Depth
Summer of 2018 Backpacking Plans?
Yosemite-Hoover-Desolation
&
John Muir Trail Hikers:
Time to
Order Next Year's Permits!
Reserved permits for June 2018 now available from Yosemite, Hoover, and Desolation Wilderness Areas. In other words, Yosemite, Desolation, and Hoover Wilderness Areas all offer advanced reservations about six months ahead of your desired hiking dates.
This means now is the time to get your JMT permit application, along with other popular hikes, into the Man.
Feb 18
Last year, during 2017, at this point in time I was estimating a powerful, potentially catastrophic Spring Thaw.
We had snow along the Sierra Crest through the whole Summer. Again, each year's thaw depends on the Winter snowpack against the profile of Spring temps and precip.
All Permits
Yosemite Permits Desolation Wilderness
All Snow Information
December
Road News & Status Links |
28 JANUARY 2020
LIGHT SHOWERS
Weak but Cooler
Pattern Note
COOL
DayS
COLD
Nights
Warming...
2020
Snowpack:
Percent of Average for
January 27
Next: Feb 3
2019
Snowpack:
Percent of Average for
January 28.
N Sierra: 106%
-5% in 4 days!!
Cen. Sierra:106%
-7% in 4 days!
S Sierra: 101%
-7% in 4 days!
Ca State: 105%
-6% in 4 days!
Last Reading
January 24
Statewide Summary of Snow Water Content PDF
2019
2017, 28th
Clear Blue Skies,
High off CA Coast
2016
Sierra approaching season-normal snow and precip for first time in years.
Station Reports
The
EIGHTH
--WINTER--
Temp-Snow
Check
January 28
2020
11 AM - 11 PM
Below: Watershed Snow Water Content Charts followed by individual reporting station's Snow Depth and 24 hour high-low temps.
Last Report:
Jan 23
Next Report:
Feb 3 2020-
Tahoe Basin
Watershed
Southwest Tahoe
Trail Map with Stations
PCT-TYT-TRT
Rubicon 36.0 −1.00
(13.20) +0.80
7618 feet
Trail Map
36 & 30 −/−
PCT-TYT-TRT
Echo Peak 51.0 +1
(20.20) + 1.20
7652 feet
Stations Map
38 & 30 −/−
American-Yuba Watersheds
PCT-TYT
Carson Pass
47.0 +1
(15.10) + 0.30
8388 feet
Trail Map
Stations Map
35 & 20 −/−
Carson-Walker
Watersheds
PCT-TYT
Ebbetts Pass
51.0 +3
(20.5) +0.70
8660 feet
Trail Map
36 & 28 −/−
West of PCT
Highlands Meadow
19.28 +1.30
(12.36) +0.40
8360 feet
Trail Map
30 & 16 −/−
Top of List
EAST FLANK
Leavitt Lake
65.0 +4.0
(16.00) +0.50
9602 feet, East Flank
Trail Map
35
& 28 −/−
EAST FLANK
Marine Base
Cold Weather Training
6748 feet East Flank
Trail Map Above
FULL REPORT
VIS-CHIL-WEA-MB-
WIND
49 & 23 −/−
Mokelumne-Stanislaus Watersheds
PCT-TYT
Sonora Pass
Kennedy Meadows
RESUPPLY
Deadman Creek
29.74 +2.59
(--.--)
9250 feet,West Flank,
Trail Map
34 & 19 −/+
Tuolumne-Merced
Watersheds
SW of TYT
Horse Meadow
Error =0.4 ???
8602 feet
Trail Map
42 & 6 −/−
Top of List
Tenaya Lake
40.43 −0.14
(4.59) +0.52
8163 feet, West Flank
Trail Map
39 & 8 −/−
JMT-PCT-TYT
Tuolumne Meadows
30.10 +0.72
(4.02) +0.36
8600 feet, West Flank
Trail Map
39
& 5 −/−
Tioga Pass/Dana
ERROR +ERROR
(1.36) +0.13 ??
9798 feet
Trail Map
33
& 13 −/−
Mammoth Mountain
Mono Lake-Owens Basin
East of PCT-JMT
Above Gem Lake
Gem Pass
(error)
10750 feet
Trail Map
temps bad
JMT-PCT Junction
Devils Postpile
27.10 −2.44
(8.43) +0.21
8004 feet
Trail Map Above
30 & 12 −/−
NE of JMT-PCT
Mammoth Pass
51.65 +0.30
(0.48) = ??
9500 feet
Trail Map
40 & 22 −/−
Top of List
JMT-PCT
E of Bear Ridge
Volcanic Knob
39.40 −0.2
(0.00) = ??
10100 feet
Trail Map
42 & 14 −/−
East Flank
South Lake Cabin
no snow sensor
(28.90) =0.0
9580 feet, East Flank
Trail Map
48 & 21 =/+
East Flank
Big Pine Sawmill
20.30 −0.9
10200 feet, East Flank
Trail Map Above
40 & 17 −/+
Kings River
Just East JMT-PCT
Bishop Pass (bad)
(0.0) =
11972 feet
Trail Map Above
-- & -- −/− (earlier)
Just West JMT-PCT
Charlotte Lake
43.03 −ERROR-
10398 feet, West Flank
Trail Map
35 & 11 +/−
(Typically the coldest station) WRONG DATE
Kern Watershed
JMT-PCT
Upr Tyndall Creek
34.24 −0.15
11441 feet
Trail Map
33 & 20 −/+
JMT
Crabtree Meadow
X.XX −X.XX error !
(33.20) +0.07
10,700 feet
Trail Map
38 & 15 −/−
? = questionable data
All High Sierra
Reporting Stations
More Stations, by Watersheds
Top of List
|
29 JANUARY 2020
CLOUDY & SUN
Warmer
Warming...
Hiking the PCT
in
2020?
From the Trail Guide
The
Earliest, Latest, and Average Start Dates
How Will This Year Stack-Up?
ON THE CALENDAR
Earliest
Start Date
Winter of 2015
Driest in History
Average
Start Date
Winter of 2016
An Average-Dry Year
Latest
Start Date
Winter of 2017
Wettest in History
When are the trails along the Sierra Crest going to be passable this year?
These three years highlighted above offer the potential range of Weather Conditions within which this year's PCTer,
"Start Date," the date you can reasonably expect to encounter fairly snow-free trails with post-deadly fording conditions, will be
determined within. These are the historic limits of wet and dry, with a perfectly average year thrown in-between.
This date, of course, depends upon your ability to navigate snow at high altitude, along with your ability to cross the various stages of the dangerous thaw waters draining off it.
You can get through before and after the period of high-flow runoff, but not during this phase.
How the conditions of the Winter to Spring
Transition we track this year measures-up to the classic trajectories of these three years cited above will inform potential PCT hikers about the snow/trail conditions along the High Sierra Crest they may reasonably expect to encounter during May, June, and July of this year measure-up against those of the Driest year in history against an Average Year, against the wettest Year in History...
This year of 2020 will fit somewhere between these historic parameters of the record Wettest and record Driest years that happened between
2015 and 2017.
As our seasonal start date for open access to trails along the High Sierra Crest will be adjusted according to the character and trajectory of this year's Winter to Spring Transition, we will watch it carefully.
Advice for
Rookie Hikers wishing to hike the TYT-JMT-PCT
More
2018
Weather Notes
TWISTED SEASONS
Hottest & Driest, then Wettest Year Ever, over Three Years
Compare Years |
30 JANUARY 2020
CLOUDY
&
CLEARING
Warmer
LAST MONTH
NEXT WEEK
TOP
2019
Snow Depth & Temps
2018
Snow Depths & Temps
2017
Snow Depth,
24 hour high & low temps
2016
The Dry Month February
This Week
TOP |
31JANUARY 2020
WEAK FRONT
little Precip
Informative
"Normal" Vs. Now
Forcasts & Reality
vs.
Averages
Point
Forecasts
Lake Tahoe Forecast
Walker Forecast
Sonora Pass Forecast
Cherry Lake Forecast
Lee Vining Forecast
Tuolumne Meadows
Mammoth Pass
Lake Thomas Edison
Lake Isabella Forecast
Move the Map Dot
to
Customize Forecast Point
Trail Maps
!!
SEASON-NORMAL SNOW
2019
Current Snowpack:
Percent of Average for
January 31.
N Sierra: 100%
-6% in 3 days!!
Cen. Sierra:102%
-4% in 3 days!
S Sierra: 97%
-4% in 3 days!
Ca State: 100%
-5% in 3 days!
2019
2018
Snowpack:
Percent of Average for
January 31.
(Change since Jan 26.)
N Sierra: 29%
(+2%)
Cen. Sierra: 35%
(+0%)
S Sierra: 21%
(-3%)
Ca State: 30%
(+0%)
2018
2017
This Week
TOP |
1
CLOUDY
&
CLEARING
Windy-Cool
February 2015
Driest Year in History
February 2016
An Average-Dry Year
February 2017
Wettest Year in History
LAST MONTH
NEXT WEEK
TOP
LAST MONTH
NEXT WEEK
TOP
2016
Above Average
Warmer Temps
&
Higher Humidity
Not a whole lot of strong weather, despite strong El Nino
2016
LAST MONTH
NEXT WEEK
TOP
LAST MONTH
NEXT WEEK
TOP |
2
CLEARING
&
COOL
Decreasing Windy-Cool
COOL
DayS
COLD
Nights
LAST WEEK
NEXT WEEK
TOP
2018
Snowpack:
Percent of Average for
February 3.
(Change since Jan 31.)
N Sierra: 27%
(-2%)
Cen. Sierra: 30%
(-5%)
S Sierra: 25%
(+4%)
Ca State: 27%
(-3%)
Last
Jan 31, 2018
Statewide Summary of Snow Water Content PDF
2018
2017
Current Snowpack:
Percent of Average for
February 3.
N Sierra: 145%
Cen. Sierra: 174%
S Sierra: 198%
Ca State: 171%
2017
|
3
CLEAR
&
COOL
Big Blocking Ridge
Patterns Note
Warnings
NWS RENO
NADA
NWS SACTO
Special Cold Statement
Tonight thru Early Wed
NWS HANFORD
NADA in Mountains
COLD
Day
COLD
Nights
2020
Snowpack:
Percent of Average for
February 3.
N Sierra: 71%
-8% in 7 days
Cen. Sierra: 74%
-8% in 7 days
S Sierra: 62%
-8% in 7 days
Ca State: 67%
-8% in 7 days
Last Reading
January 27
Next Reading
Feburary 10
Statewide Summary of Snow Water Content PDF
Station Reports
The
NINTH
--WINTER--
Temp-Snow
Check
February 3
2020
12 PM - 12 PM
Below: Watershed Snow Water Content Charts followed by individual reporting station's Snow Depth and 24 hour high-low temps.
Last Report:
Jan 28
Next Report:
Feb 10
Tahoe Basin
Watershed
Southwest Tahoe
Trail Map with Stations
PCT-TYT-TRT
Rubicon 34.0 −2.00
(13.00) −0.20
7618 feet
Trail Map
34 & 11 −/−
PCT-TYT-TRT
Echo Peak 49.0 −2
(20.20) + 1.10
7652 feet
Stations Map
32 & 12 −/−
American-Yuba Watersheds
PCT-TYT
Carson Pass
46.0 −1
(15.00) −0.10
8388 feet
Trail Map
Stations Map
31 & 6 −/−
Carson-Walker
Watersheds
PCT-TYT
Ebbetts Pass
50.0 −1
(20.6) +0.10
8660 feet
Trail Map
34 & 6 −/−
West of PCT
Highlands Meadow
18.77 −0.51
(11.89) −0.47
8360 feet
Trail Map
26 & 3 −/−
Top of List
EAST FLANK
Leavitt Lake
66.0 +1.0
(16.20) +0.20
9602 feet, East Flank
Trail Map
28
& −1 −/−
EAST FLANK
Marine Base
Cold Weather Training
6748 feet East Flank
Trail Map Above
FULL REPORT
VIS-CHIL-WEA-MB-
WIND
50 & 16 +/−
Mokelumne-Stanislaus Watersheds
PCT-TYT
Sonora Pass
Kennedy Meadows
RESUPPLY
Deadman Creek
27.43 −2.31
(--.--)
9250 feet,West Flank,
Trail Map
30 & −5 −/−
Tuolumne-Merced
Watersheds
SW of TYT
Horse Meadow
Error =0.4 ???
8602 feet
Trail Map
28 & 5 −/−
Top of List
Tenaya Lake
39.83 −0.6
(4.59) =0.00
8163 feet, West Flank
Trail Map
34 & 4 −/−
JMT-PCT-TYT
Tuolumne Meadows
29.51 −0.59
(4.02) =0.00
8600 feet, West Flank
Trail Map
36 & −9 −/−
Tioga Pass/Dana
ERROR +ERROR
(1.59) +0.23 ??
9798 feet
Trail Map
31
& −7 −/−
Mammoth Mountain
Mono Lake-Owens Basin
East of PCT-JMT
Above Gem Lake
Gem Pass
(error)
10750 feet
Trail Map
temps bad
JMT-PCT Junction
Devils Postpile
23.67 −3.43
(8.65) +0.22
8004 feet
Trail Map Above
39 & 8 +/−
NE of JMT-PCT
Mammoth Pass
50.06 −1.59
(0.48) = ??
9500 feet
Trail Map
35 & 2 −/−
Top of List
JMT-PCT
E of Bear Ridge
Volcanic Knob
36.40 −3
(0.00) = ??
10100 feet
Trail Map
41 & 1 −/−
East Flank
South Lake Cabin
no snow sensor
(28.90) =0.0
9580 feet, East Flank
Trail Map
41 & −3 −/−
East Flank
Big Pine Sawmill
18.90 −1.4
10200 feet, East Flank
Trail Map Above
37 &−6 −/−
Kings River
Just East JMT-PCT
Bishop Pass (bad)
(0.0) =
11972 feet
Trail Map Above
-- & -- −/− (earlier)
Just West JMT-PCT
Charlotte Lake
43.03 −ERROR-
(71.64)
10398 feet, West Flank
Trail Map
36 & −9 +/−
(Typically the coldest station)
Kern Watershed
JMT-PCT
Upr Tyndall Creek
35.01 +0.77
11441 feet
Trail Map
35 & −3 +/−
JMT
Crabtree Meadow
X.XX −X.XX error !
(33.07) −0.13
10,700 feet
Trail Map
40 & −1 +/−
? = questionable data
All High Sierra
Reporting Stations
More Stations, by Watersheds
Top of List |
4
CRISP-CLEAR
&
COOL
Cold North Wind
Big Blocking Ridge
TRENDS
No Warnings
NWS RENO
NADA
NWS SACTO
NADA
NWS HANFORD
NADA in Mountains
Cold Conditions!
COOL
DayS
COLD
Nights
LAST WEEK
NEXT WEEK
TOP
!!
ABOVE-AVERAGE SNOW
2019
Current Snowpack:
Percent of Average for
February 4.
N Sierra: 107%
+7% in 4 days!!
Cen. Sierra:117%
+15% in 4 days!
S Sierra: 119%
+22% in 4 days!
Ca State: 115%
+15% in 4 days!
Last Reading
January 31
Winter of 2018
Big High
Generating Heat
Heat Wave
DROUGHT CONDITIONS EMERGE IN MID-WINTER
United States Drought Monitor: West
High Sierra Weather Page
Drought & Flood
2016
THIS YEAR:
NOT TOO COLD AT ALL.
2016
REALTIME
High Sierra Crestline
Reporting Stations
WINTER
2020
Fall to Winter
Compare Today
with
Snow
&
Temperatures
on
Jan 28
Jan 23
Jan 13 & 17
Jan 8
Jan 2
Dec 30
Dec 24
Full Winter Report
|
5
CRISP-CLEAR
&
WARMING
Seven Day
Freezing Temperature Probability Model
HIGH SIERRA
SNOW INFO
All Snow Info
SNOW STATUS
&
FORECASTS
THE SNOWPACK
GRAPHICS
Date-Adjustable
High Sierra Snowpack Status
NOAA-NOHRSC
The High Sierra
2-4-20
Mountain Safety
AVALANCHE DANGERS
Winter Backpacking
Considerations
!!
ABOVE-AVERAGE SNOW
2019
Current Snowpack:
Percent of Average for
February 5 .
N Sierra: 111%
+4% in 1 day!!
Cen. Sierra:128%
+11% in 1 day!!
S Sierra: 133%
+14% in 1 day!!
Ca State: 125%
+10% in 1 day!! 2019
This Week
TOP
2016
The Dry Month February
2016
5
RECORD
AND
NEAR RECORD
HIGH TEMPS
2016
5
RECORD
AND
NEAR RECORD
HIGH TEMPS
Great
Northeast Pacific Highs deflecting weak storms OUT OF THE SW around the Sierra.
2016 |
6
CRISP-CLEAR
&
WARM
Big Blocking Ridge
Patterns Note
Big Blocking Ridge
TRENDS
MAPS
Point
Forecasts
Lake Tahoe Forecast
Walker Forecast
Sonora Pass Forecast
Cherry Lake Forecast
Lee Vining Forecast
Tuolumne Meadows
Mammoth Pass
Lake Thomas Edison
Lake Isabella Forecast
Move the Map Dot
to
Customize Forecast Point
Trail Maps
2019
Snow Depth & Temps
2018
Snow Depths & Temps
2017
Snow Depth,
24 hour high & low temps
2016
Snow Depths & Temps
BEST
FORECASTS
HAZARDS
Precipitation
General
Quantitative Precipitation Forecasts:
ALL
RAIN FORECASTS
&
MODELS
Direct to
Seven Day Precip
Animation
Precipitation
Geographic
All High Sierra
ZONE & POINT
FORECASTS
All High Sierra
ZONE
FORECASTS
Now
RADAR
SATELLITES
Direct
to
GRAPHICAL INTERFACE
Forecast
Winds? Weather?
NorCal Graphics
Region, SW US
Forecast
Temperatures
Model
Five Day Mean
Low Temps
Click Green "Latest" Model,
observe using step button
All Temps
Let's look at the
Big Picture
Surface Map
The Pacific Ocean
US Weather Map
All Maps
This Week
TOP
This Week
TOP
This Week
TOP |
7
CLEAR
&
WARM
Big Blocking Ridge
Bookends of Extremity
2015 & 2017
Driest Year in History?
2015
2015 was the driest year in my life observing the Sierra, California, Nevada, and the Southwest, and likely across all of modern history, requiring a punch deep back into Ancient history to find its equal.
I had just started keeping the calendar in 2015, and did not specifically start noting the lack of snow across February, not until March, and we can see how it was ALL gone by the First of May.
2015
Earliest PCT Launch EVER
Bloom was resupplying PCT hikers in May, 2015, unprecedentedly early.
Extremes
2015 was an extreme example of a West Coast Drought during these drying and warming times.
2017
WETTEST YEAR
LATEST PCT LAUNCH EVER
The incredible dryness of 2015 was quickly followed by the deluges of 2017, which presented us with a three year streak where we recorded both the wettest and driest years in modern history within a rapid three-year succession.
What does This Mean
in
2019
?
These recent-past extremes are indicative of a system, more specifically, our region of the planatary weather system, that's out of, "wack."
Extremes
are the
New Normal
I'd say we are still looking at a system that will continue to produce extreme results, as the ancient balances that centered and held the range of our traditional weather patterns continue to break down from the inside-out, and the outside-in.
Not only are extreme events possible, they have become likely.
2020:
Anything can happen,
though I am thinking a very early opening of the Sierra is quite possible, even likely, in my view.
LAST WEEK
NEXT WEEK
TOP |
8
CLEAR
&
WARM
Big Blocking Ridge
LAST WEEK
NEXT WEEK
TOP
Informative
"Normal" Vs. Now
Forcasts & Reality
vs.
Averages
LAST WEEK
NEXT WEEK
TOP
2017
No information about a 2017 ADZPCTKO
2017
PM:
Big Tropical Flow out of
SW hits the Coast of Ca.
PM:
Raining across
Sierra Crest
Most stations above freezing to 40 degrees
ALL STORMS THIS SEASON HAVE COME OUT OF THE WEST & SOUTHWEST: Warm Storms...
Oroville Dam Crisis News
2016
ADZPCTKO
"PLANNING STAGES"
2016
TWO EVENTS
IN
2015
April 22-24
April 24-26
I bet it will be later this year, or PCTers will hit snow in the Sierra...
NONE IN 2016
LAST WEEK
NEXT WEEK
TOP
LAST WEEK
NEXT WEEK
TOP |
9
CLEAR,
WARM
&
WINDY
Big Blocking Ridge
Daytime:
Warm @ Low Altitude
Cold @ High Altitude
MAPS
Warnings
NWS RENO
NE SIERRA WIND
Today thru Early Mon
NWS SACTO
N SIERRA WIND
Tonight thru Early Mon
NWS HANFORD
NADA in Mountains
NWS VEGAS
E. SIERRA FLANK WIND
thru Early Mon
COLD
Day
At Elevation...
COLD
Night
Seven Day
Freezing Temperature Probability Model
HIGH SIERRA
SNOW INFO
All Snow Info
SNOW STATUS
&
FORECASTS
THE SNOWPACK
GRAPHICS
Date-Adjustable
High Sierra Snowpack Status
NOAA-NOHRSC
The High Sierra
2-9-20
Mountain Safety
AVALANCHE DANGERS
Winter Backpacking
Considerations
2016
Record Level Temps
High Heat and Humidity...
Plum and Cherry trees blossoming at Sea Level.
2016
The Dry Month February
|
10
CLEAR &
WARM
Warming
COLD
Nights
Note that many stations remained below freezing for last 24 hours.
Warnings
NWS RENO
NE SIERRA WIND
To 4PM Today
NWS SACTO
N SIERRA WIND
To 4PM Today
NWS HANFORD
NADA in Mountains
NWS VEGAS
E. SIERRA FLANK WIND
To 4PM Today
2020
Snowpack:
Percent of Average for
February 10.
N Sierra: 64%
-7% in 7 days
Cen. Sierra: 58%
-16% in 7 days
S Sierra: 56%
-6% in 7 days
Ca State: 60%
-7% in 7 days
Last Reading
Feb 3
Next Reading
Feb 20
Statewide Summary of Snow Water Content PDF
Station Reports
The
TENTH
--WINTER--
Temp-Snow
Check
February 10
2020
10 AM - 10 AM
Below: Watershed Snow Water Content Charts followed by individual reporting station's Snow Depth and 24 hour high-low temps.
Last Report:
Feb 3
Next Report:
Feb 20
Tahoe Basin
Watershed
Southwest Tahoe
Trail Map with Stations
PCT-TYT-TRT
Rubicon 38.0 +4.00
(13.20) + 0.20
7618 feet
Trail Map
35 & 19 +/+
PCT-TYT-TRT
Echo Peak 44.0 −5
(21.20) + 1.00
7652 feet
Stations Map
33 & 18 +/+
American-Yuba Watersheds
PCT-TYT
Carson Pass
45.0 −1
(15.10) +0.10
8388 feet
Trail Map
Stations Map
30 & 15 −/+
Carson-Walker
Watersheds
PCT-TYT
Ebbetts Pass
44.0 −6
(20.7) +0.10
8660 feet
Trail Map
30 & 13 −/+
West of PCT
Highlands Meadow
15.43 −3.34
(12.20) +0.31
8360 feet
Trail Map
30 & 26 +/+
Top of List
EAST FLANK
Leavitt Lake
61.0 −5.0
(16.30) +0.10
9602 feet, East Flank
Trail Map
25 & 11 −/+
EAST FLANK
Marine Base
Cold Weather Training
6748 feet East Flank
Trail Map Above
FULL REPORT
VIS-CHIL-WEA-MB-
WIND
30 & 21 −/+
Mokelumne-Stanislaus Watersheds
PCT-TYT
Sonora Pass
Kennedy Meadows
RESUPPLY
Deadman Creek
25.27 −2.16
(--.--)
9250 feet,West Flank,
Trail Map
29 & 12 −/+
Tuolumne-Merced
Watersheds
SW of TYT
Horse Meadow
Error =0.4 ???
8602 feet
Trail Map
28 & 15 =/+
Top of List
Tenaya Lake
38.49 −1.34
(4.60) +0.01
8163 feet, West Flank
Trail Map
32 & 15 −/+
JMT-PCT-TYT
Tuolumne Meadows
28.33 −1.18
(4.05) +0.03
8600 feet, West Flank
Trail Map
34 & 13 +/+
Tioga Pass/Dana
ERROR +ERROR
(1.65) +0.06 ??
9798 feet
Trail Map
28
& 5 −/+
Mammoth Mountain
Mono Lake-Owens Basin
East of PCT-JMT
Above Gem Lake
Gem Pass
(error)
10750 feet
Trail Map
temps bad
JMT-PCT Junction
Devils Postpile
19.70 −3.97
(8.65) =0.00
8004 feet
Trail Map Above
32 & 20 −/+
NE of JMT-PCT
Mammoth Pass
48.00 −2.06
(0.56) = +.08
9500 feet
Trail Map
19 & 9 −/+
Top of List
JMT-PCT
E of Bear Ridge
Volcanic Knob
36.10 −0.3
(0.00) = ??
10100 feet
Trail Map
22 & 9 −/+
East Flank
South Lake Cabin
no snow sensor
(28.90) =0.0
9580 feet, East Flank
Trail Map
28 & 2 −/+
East Flank
Big Pine Sawmill
17.70 −1.2
10200 feet, East Flank
Trail Map Above
24 & −1 −/+
Kings River
Just East JMT-PCT
Bishop Pass (bad)
(0.0) =
11972 feet
Trail Map Above
-- & -- −/− (earlier)
Just West JMT-PCT
Charlotte Lake
43.03 −ERROR-
(71.93) +0.29
10398 feet, West Flank
Trail Map
24 & 11 −/+
(Typically the coldest station)
Kern Watershed
JMT-PCT
Upr Tyndall Creek
34.57 −0.44
11441 feet
Trail Map
19 & 6 −/+
JMT
Crabtree Meadow
X.XX −X.XX error !
(33.00) −0.07
10,700 feet
Trail Map
21 & 9 −/+
? = questionable data
All High Sierra
Reporting Stations
More Stations, by Watersheds
Top of List
|
11
CLEAR &
HOT
Records in Calif
COLD
Nights
LAST WEEK
NEXT WEEK
TOP
Last Day
CCC
Backcountry Trail Crew
Applications due
RECOMENDED:
BACKCOUNTRY TRAIL CREW
Last 100% Reading
December 26, 2019
Winter of 2018
High Pressure Heatwave Broken-Weakened
HIGH PRESSURE ZONE MOVES NORTHWEST:
A weak Low dragging a weak Cold Front tracked Southeast around this High's Northern end, and down its Norheast flank, finally bringing cloud cover and very light precip to the Sierra with the front, and cold air coming in behind the Cold Front.
Temps down about ten degrees.
2017
(Feb 10)
Clearing & Drying After nine days of various degrees of precip...
Snow Depth,
24 hour high & low temps.
Carson Pass 130"
(36.00" H2O)
41 & 31
Ebbetts Pass 150"
40 & 30
2017
2016
VERY HOT
(Feb 10)
Echo Summit,
Carson Pass,
Ebbetts Pass,
Sonora Pass
2016 |
12
CLOUDY
Cooler
COLD
Nights
Seven Day
Freezing Temperatures
Probability Model
HIGH SIERRA
SNOW INFO
All Snow Info
SNOW STATUS
&
FORECASTS
THE SNOWPACK
GRAPHICS
Date-Adjustable
High Sierra Snowpack Status
NOAA-NOHRSC
The High Sierra
2-9-20
Mountain Safety
AVALANCHE DANGERS
Winter Backpacking
Considerations
2018
Snow Depths & Temps
2018
Snowpack:
Percent of Average for
February 12.
(Change since Feb 3.)
N Sierra: 17%
(-10%)
Cen. Sierra: 24%
(-7%)
S Sierra: 17%
(-10%)
Ca State: 17%
(-13%)
2018
Next 2017 Measure
March 1.
This Week
TOP
This Week
TOP
|
13
CLOUDY
Cooler
COLD
Nights
Big Blocking Ridge
Patterns Note
Big Blocking Ridge
TRENDS
MAPS
Point
Forecasts
Lake Tahoe Forecast
Walker Forecast
Sonora Pass Forecast
Cherry Lake Forecast
Lee Vining Forecast
Tuolumne Meadows
Mammoth Pass
Lake Thomas Edison
Mount Whitney-Lone Pine
Lake Isabella Forecast
Move the Map Dot
to
Customize Forecast Point
Trail Maps
2017
High Overcast, Altocumulus leading edge (?), & High Pressure Zone dropping South, Dry
Oroville Dam Crisis News
Oroville predicted to see 7.6 inches of precip next 7 days.
All Precip Forecasts, Averages, & Anomalies.
California Major Reservoir current and historical levels
2017
Plum and Cherry trees blossoming at Sea Level.
2017
LAST WEEK
NEXT WEEK
TOP |
14
CLOUDY
&
CLEARING
BEST
FORECASTS
HAZARDS
Precipitation
General
Quantitative Precipitation Forecasts:
ALL
RAIN FORECASTS
&
MODELS
Direct to
Seven Day Precip
Animation
Precipitation
Geographic
All High Sierra
ZONE & POINT
FORECASTS
All High Sierra
ZONE
FORECASTS
Now
RADAR
SATELLITES
Direct
to
GRAPHICAL INTERFACE
Forecast
Winds? Weather?
NorCal Graphics
Region, SW US
Forecast
Temperatures
Model
Five Day Mean
Low Temps
Click Green "Latest" Model,
observe using step button
All Temps
Let's look at the
Big Picture
Surface Map
The Pacific Ocean
US Weather Map
All Maps
LAST WEEK
NEXT WEEK
TOP
This Week
TOP |
15
CLOUDY
LAST WEEK
NEXT WEEK
TOP
2019
Current Snowpack:
Percent of Average for
February 15.
N Sierra: 125%
+1% in 1 day
Cen. Sierra:147%
+8% in 1 day
S Sierra: 149%
+7% in 1 day
Ca State: 141%
+5% in 1 day 2019
2017
Snow & Temp Report
2016
Presidents' Day
RECORD, or NEAR
RECORD HOT TEMPERTURES
Heat continues since the beginning of the month.
2016
LAST WEEK
NEXT WEEK
TOP
|
16
WEAK FRONT
CLOUDY
Warm
LAST WEEK
NEXT WEEK
TOP
COLD
Nights
note
Staying and Getting Cold Nights at High Elevation, despite warmth at lower elevations.
This cold is preserving the pathetic snowpack, despite the lack of precip. |
17
PRESIDENTS' DAY
CLOUDY
to
CLEAR
Warm
Late Spring-Like
Big Blocking Ridge
Patterns Note
Big Blocking Ridge
TRENDS
MAPS
LAST WEEK
NEXT WEEK
TOP |
18
CLOUDY
to
CLEAR
Warm
NO PRECIP
Hiking the PCT
in
2020?
2018
Snowpack:
Percent of Average for
February 22.
(Change since Feb 12.)
N Sierra: 17%
(=)
Cen. Sierra: 23%
(-1%)
S Sierra: 19%
(+2%)
Ca State: 19%
(+2%)
2018
Snow Depths & Temps
2017
Snow & Temp Report
2016
RECORD, or NEAR RECORD HOT TEMPERTURES.
Heat continues since the beginning of the month. |
19
YOSEMITE FIREFALL
CLOUDY
to
CLEAR
Warm
2019
Current Snowpack:
Percent of Average for
February 19.
N Sierra: 127%
+2% in 4 days
Cen. Sierra:154%
+7% in 4 days
S Sierra: 152%
+3% in 4 days
Ca State: 146%
+5% in 4 days
Last Reading
Feb 15
2019
YOS FIREFALL TIME
Yosemite Natural Firefall
History of,...
History
Tourist Fire Version
REALTIME
High Sierra Crestline
Reporting Stations
WINTER
2020
Fall to Winter
Compare Today
with
Snow
&
Temperatures
on
Feb 10
Feb 3
Jan 28
Jan 23
Jan 13 & 17
Jan 8
Jan 2
Dec 30
Dec 24
Full Winter Report
This Week
TOP
This Week
TOP
This Week
TOP |
20
CLOUDY
to
CLEAR
Warm-Hazy
South Sierra Storm
TROPICAL ORIGINS
Expected Saturday
2020
Snowpack:
Percent of Average for
February 20.
N Sierra: 57%
-7% in 10 days
Cen. Sierra: 51%
-7% in 10 days
S Sierra: 46%
-10% in 10 days
Ca State: 52%
-8% in 10 days
Last Reading
Feb 10
Next Reading
Feb 26
Statewide Summary of Snow Water Content PDF
Station Reports
The
ELEVENTH
--WINTER--
Temp-Snow
Check
February 20
2020
3 PM - 3 PM
Below: Watershed Snow Water Content Charts followed by individual reporting station's Snow Depth and 24 hour high-low temps.
Last Report:
Feb 10
Next Report:
Feb 27
Tahoe Basin
Watershed
Southwest Tahoe
Trail Map with Stations
PCT-TYT-TRT
Rubicon 32.0 −6.00
(13.30) + 0.10
7618 feet
Trail Map
40 & 29 +/+
PCT-TYT-TRT
Echo Peak 42.0 −2
(21.50) + 0.30
7652 feet
Stations Map
45 & 29 +/+
American-Yuba Watersheds
PCT-TYT
Carson Pass
42.0 −3
(15.40) +0.30
8388 feet
Trail Map
Stations Map
41 & 24 +/+
Carson-Walker
Watersheds
PCT-TYT
Ebbetts Pass
43.0 −1
(20.9) +0.20
8660 feet
Trail Map
42 & 22 +/+
West of PCT
Highlands Meadow
10.46 −4.97
(19.78) +7.58
8360 feet
Trail Map
41 & 17 +/−
Top of List
EAST FLANK
Leavitt Lake
61.0 =0.0
(16.50) +0.20
9602 feet, East Flank
Trail Map
38 & 22 +/+
EAST FLANK
Marine Base
Cold Weather Training
6748 feet East Flank
Trail Map Above
FULL REPORT
VIS-CHIL-WEA-MB-
WIND
48 & 16 +/−
Mokelumne-Stanislaus Watersheds
PCT-TYT
Sonora Pass
Kennedy Meadows
RESUPPLY
Deadman Creek
24.52 −0.75
(--.--)
9250 feet,West Flank,
Trail Map
42 & 15 +/+
Tuolumne-Merced
Watersheds
SW of TYT
Horse Meadow
Error =0.4 ???
8602 feet
Trail Map
41 & 8 +/−
Top of List
Tenaya Lake
34.29 −4.2
(4.60) = 0.00
8163 feet, West Flank
Trail Map
44 & 12 +/−
JMT-PCT-TYT
Tuolumne Meadows
22.78 −5.55
(4.05) =0.00
8600 feet, West Flank
Trail Map
45 & 9 +/−
Tioga Pass/Dana
ERROR +ERROR
(1.71) +0.06 ??
9798 feet
Trail Map
39 & 11 +/+
Mammoth Mountain
Mono Lake-Owens Basin
East of PCT-JMT
Above Gem Lake
Gem Pass
(error)
10750 feet
Trail Map
temps bad
JMT-PCT Junction
Devils Postpile
10.59 −9.11
(8.65) =0.00
8004 feet
Trail Map Above
46 & 14 +/−
NE of JMT-PCT
Mammoth Pass
43.32 −4.68
(0.56) = +.00
9500 feet
Trail Map
41 & 20 +/+
Top of List
JMT-PCT
E of Bear Ridge
Volcanic Knob
34.20 −1.9
(0.00) = ??
10100 feet
Trail Map
41 & 11 +/+
East Flank
South Lake Cabin
no snow sensor
(28.90) =0.0
9580 feet, East Flank
Trail Map
42 & 14 +/+
East Flank
Big Pine Sawmill
16.20 −1.5
10200 feet, East Flank
Trail Map Above
39 & 12 +/+
Kings River
Just East JMT-PCT
Bishop Pass (bad)
(0.0) =
11972 feet
Trail Map Above
-- & -- −/− (earlier)
Just West JMT-PCT
Charlotte Lake
13.17 −ERROR?-
(72.04) +0.11
10398 feet, West Flank
Trail Map
37 & 11 +/=
(Typically the coldest station)
Kern Watershed
JMT-PCT
Upr Tyndall Creek
34.03 −0.54
11441 feet
Trail Map
36 & 10 +/+
JMT
Crabtree Meadow
xx.xx ERROR −X.XX
(33.48) +0.48
10,700 feet
Trail Map
38 & 10 +/+
? = questionable data
All High Sierra
Reporting Stations
More Stations, by Watersheds
Top of List
|
21
Clear & Warm
Late Spring-Like Warmth
Informative
"Normal" Vs. Now
Forcasts & Reality
vs.
Averages
Point
Forecasts
Lake Tahoe Forecast
Walker Forecast
Sonora Pass Forecast
Cherry Lake Forecast
Lee Vining Forecast
Tuolumne Meadows
Mammoth Pass
Lake Thomas Edison
Mount Whitney-Lone Pine
Lake Isabella Forecast
Move the Map Dot
to
Customize Forecast Point
Trail Maps
2017 Calendar:
The 18th
News of Note
Feb 2017:
Record Precip
Record Snopack
State fully saturated
Oroville Dam Crisis
LAST WEEK
NEXT WEEK
TOP |
22
TROPICAL CLOUDY
South Sierra
with
CLEAR & WARM
North Sierra
Drought
Considerations
Late Spring-Like Warmth
Factors Affecting
how this
WINTER
will
WORK OUT
Now
Big Blocking Ridge
Patterns Note
Big Blocking Ridge
TRENDS
MAPS
Potential
Drought?
Blast from the Past,
Or the, "New Normal?"
The Ridiculously Resilient Ridge
Climate Change News:
The Big Blocking Ridge an Existential Threat
Weather Monitoring
Drought Reporting
TODAY
Tropical Weather
RUNS SOUTH
of
South Sierra -- SOCAL
Satellite View
Potential
Drought Relief?
Weather
TROPICAL TRANSPORT
MECHANISM
Information
TROPICAL TRANSPORT
MECHANISM
Related Phenomena
THE BLOB
Search
THE BLOB
LAST WEEK
NEXT WEEK
TOP
BEST
FORECASTS
HAZARDS
Precipitation
General
Quantitative Precipitation Forecasts:
ALL
RAIN FORECASTS
&
MODELS
Direct to
Seven Day Precip
Animation
Precipitation
Geographic
All High Sierra
ZONE & POINT
FORECASTS
All High Sierra
ZONE
FORECASTS
Now
RADAR
SATELLITES
Direct
to
GRAPHICAL INTERFACE
Forecast
Winds? Weather?
NorCal Graphics
Region, SW US
Forecast
Temperatures
Model
Five Day Mean
Low Temps
Click Green "Latest" Model,
observe using step button
All Temps
Let's look at the
Big Picture
Surface Map
The Pacific Ocean
US Weather Map
All Maps
LAST WEEK
NEXT WEEK
TOP
LAST WEEK
NEXT WEEK
TOP
|
23
Clear & Warm
Late Spring-Like Warmth
LAST WEEK
NEXT WEEK
TOP
2018
Snow Depths & Temps
2017
Snow Depths & Temps Carson Pass
31 & 24 degrees
150 inches
Ebbetts Pass
30 & 23 degrees
169 inches
Sonora Pass
26 & 7 degrees
-- inches
Tuolumne Meadows
-- & -- degrees
-- inches
2016
Carson Pass
53 & 28 degrees
26 inches
Ebbetts Pass
54 & 33 degrees
63 inches
Sonora Pass
53 & 27 degrees
55 inches
Tuolumne Meadows
55 & 14 degrees
51 inches
|
24
Clear & Warm
Late Spring-Like Warmth
BEST
FORECASTS
HAZARDS
Precipitation
General
Quantitative Precipitation Forecasts:
ALL
RAIN FORECASTS
&
MODELS
Direct to
Seven Day Precip
Animation
Precipitation
Geographic
All High Sierra
ZONE & POINT
FORECASTS
All High Sierra
ZONE
FORECASTS
Now
RADAR
SATELLITES
Direct
to
GRAPHICAL INTERFACE
Forecast
Winds? Weather?
NorCal Graphics
Region, SW US
Forecast
Temperatures
Model
Five Day Mean
Low Temps
Click Green "Latest" Model,
observe using step button
All Temps
Let's look at the
Big Picture
Surface Map
The Pacific Ocean
US Weather Map
All Maps |
25
Clear & Warm
Early Summer-Like
HEAT
Record-Level
Temps
note
Cold Nights at High Elevations, despite warmth at lower elevations, have been preserving this thin snowpack.
Now it is warming at High Elevations.
2018
Snow Depths & Temps
2018
Snowpack:
Percent of Average for
February 22.
(Change since Feb 12.)
N Sierra: 17%
(=)
Cen. Sierra: 23%
(-1%)
S Sierra: 19%
(+2%)
Ca State: 19%
(+2%)
2018
|
26
Clear & Warm
Early Summer-Like
HEAT
Big Blocking Ridge
Big Blocking Ridge
Patterns Note
Big Blocking Ridge
TRENDS
MAPS
2020
Snowpack:
Percent of Average for
February 26.
N Sierra: 51%
-6% in 6 days
Cen. Sierra: 46%
-5% in 6 days
S Sierra: 43%
-3% in 6 days
Ca State: 47%
-5% in 6 days
Last Reading
Feb 20
Next Reading
March 2
Statewide Summary of Snow Water Content PDF
HIGH SIERRA
SNOW INFO
All Snow Info
SNOW STATUS
&
FORECASTS
THE SNOWPACK
GRAPHICS
Date-Adjustable
High Sierra Snowpack Status
NOAA-NOHRSC
The High Sierra
2-26-20
Mountain Safety
AVALANCHE DANGERS
Winter Backpacking
Considerations
This Week
TOP |
27
Clear & Hot
Summer-Like
HEAT
Informative
"Normal" Vs. Now
Forcasts & Reality
vs.
Averages
2019
Current Snowpack:
Percent of Average for
February 27.
N Sierra: 147%
+20% in 2 days
Cen. Sierra:154%
+0% in 2 days
S Sierra: 146%
+2% in 2 days
Ca State: 151%
+5% in 2 days
Last Reading
Feb 25 2019
Station Reports
The
TWELVETH
--WINTER--
Temp-Snow
Check
February 27
2020
4 PM - 4 PM
Below: Watershed Snow Water Content Charts followed by individual reporting station's Snow Depth and 24 hour high-low temps.
Last Report:
Feb 20
Next Report:
March 2
Tahoe Basin
Watershed
Southwest Tahoe
Trail Map with Stations
PCT-TYT-TRT
Rubicon 30.0 −1.00
(13.40) + 0.10
7618 feet
Trail Map
51 & 36 +/+
PCT-TYT-TRT
Echo Peak 39.0 −3
(21.60) + 0.10
7652 feet
Stations Map
54 & 36 +/+
American-Yuba Watersheds
PCT-TYT
Carson Pass
40.0 −2
(15.60) +0.20
8388 feet
Trail Map
Stations Map
52 & 28 +/+
Carson-Walker
Watersheds
PCT-TYT
Ebbetts Pass
39.0 −4
(21.1) +0.20
8660 feet
Trail Map
53 & 33 +/+
West of PCT
Highlands Meadow
6.56 −3.9
(20.47) +0.69
8360 feet
Trail Map
49 & 24 +/+
Top of List
EAST FLANK
Leavitt Lake
57.0 −4.0
(16.60) +0.10
9602 feet, East Flank
Trail Map
49 & 32 +/+
EAST FLANK
Marine Base
Cold Weather Training
6748 feet East Flank
Trail Map Above
FULL REPORT
VIS-CHIL-WEA-MB-
WIND
62 & 15 +/−
Mokelumne-Stanislaus Watersheds
PCT-TYT
Sonora Pass
Kennedy Meadows
RESUPPLY
Deadman Creek
22.88 −1.64
(--.--)
9250 feet,West Flank,
Trail Map
42 & 17 =/+
Tuolumne-Merced
Watersheds
SW of TYT
Horse Meadow
Error =0.4 ???
8602 feet
Trail Map
52 & 16 +/+
Top of List
Tenaya Lake
31.14 −3.15
(4.60) = 0.00
8163 feet, West Flank
Trail Map
54 & 19 +/+
JMT-PCT-TYT
Tuolumne Meadows
17.65 −5.13
(4.05) =0.00
8600 feet, West Flank
Trail Map
54 & 16 +/+
Tioga Pass/Dana
ERROR +ERROR
(1.71) =0.00 ??
9798 feet
Trail Map
46 & 20 +/+
Mammoth Mountain
Mono Lake-Owens Basin
East of PCT-JMT
Above Gem Lake
Gem Pass
(error)
10750 feet
Trail Map
temps bad
JMT-PCT Junction
Devils Postpile
3.53 −7.06
(8.65) =0.00
8004 feet
Trail Map Above
55 & 20 +/+
NE of JMT-PCT
Mammoth Pass
39.07 −4.25
(0.64) = +.08
9500 feet
Trail Map
51 & 28 +/+
Top of List
JMT-PCT
E of Bear Ridge
Volcanic Knob
32.70 −1.5
(0.00) = ??
10100 feet
Trail Map
50 & 19 +/+
East Flank
South Lake Cabin
no snow sensor
(29.10) +0.2
9580 feet, East Flank
Trail Map
56 & 22 +/+
East Flank
Big Pine Sawmill
16.00 −0.2
10200 feet, East Flank
Trail Map Above
45 & 19 +/+
Kings River
Just East JMT-PCT
Bishop Pass (bad)
(0.0) =
11972 feet
Trail Map Above
-- & -- −/− (earlier)
Just West JMT-PCT
Charlotte Lake
xx.xx −ERROR?-
(72.72) +0.68
10398 feet, West Flank
Trail Map
44 & 18 +/+
(Typically the coldest station)
Kern Watershed
JMT-PCT
Upr Tyndall Creek
33.69 −0.34
11441 feet
Trail Map
46 & 24 +/+
JMT
Crabtree Meadow
xx.xx ERROR −X.XX
(34.07) +0.59
10,700 feet
Trail Map
44 & 20 +/+
? = questionable data
All High Sierra
Reporting Stations
More Stations, by Watersheds
Top of List
|
28
Cooler & Cloudy
Low(s) Passing
to our
North
Point
Forecasts
Lake Tahoe Forecast
Walker Forecast
Sonora Pass Forecast
Cherry Lake Forecast
Lee Vining Forecast
Tuolumne Meadows
Mammoth Pass
Lake Thomas Edison
Mount Whitney-Lone Pine
Lake Isabella Forecast
Move the Map Dot
to
Customize Forecast Point
Trail Maps
2016
Another
Summer-like day,
Humid Clouds-Near Record Temps
2016
This Week
TOP
This Week
TOP
This Week
TOP |
29
Cooler & Cloudy
Weak Low
Off
North Ca Coast
Drawing
Tropical Moisture North
LAST WEEK
NEXT WEEK
TOP
Hiking the PCT
in
2020?
Potential
Drought?
Blast from the Past,
Or the, "New Normal?"
The Ridiculously Resilient Ridge
Climate Change News:
The Big Blocking Ridge an Existential Threat
Weather Monitoring
Drought Reporting
TODAY
Tropical Weather
RUNS SOUTH
of
South Sierra -- SOCAL
Satellite View
Potential
Drought Relief?
Weather
TROPICAL TRANSPORT
MECHANISM
Information
TROPICAL TRANSPORT
MECHANISM
Related Phenomena
THE BLOB
Search
THE BLOB
2016
Another
Summer-like day,
Humid Clouds-Near Record Temps
LAST WEEK
NEXT WEEK
TOP
LAST WEEK
NEXT WEEK
TOP
LAST WEEK
NEXT WEEK
TOP
LAST WEEK
NEXT WEEK
TOP
|
1 MARCH 2020
Cooler & Cloudy
Weak Low Passing
across
North Sierra
Cool Day
light
SNOW!
See the Snow
COLD
Night
LAST WEEK
NEXT MONTH
Top
2019
Current Snowpack:
Percent of Average for
March 1.
N Sierra: 152%
+5% in 2 days
Cen. Sierra:156%
+2% in 2 days
S Sierra: 147%
+1% in 2 days
Ca State: 153%
+2% in 2 days
2019
2018
Snowpack:
Percent of Average for
March 1.
(Change since Feb 24.)
N Sierra: 20%
(+3%)
Cen. Sierra: 27%
(+4%)
S Sierra: 22%
(+3%)
Ca State: 24%
(+5%)
2018
2018, End of Feb
Snow Depths & Temps
2017 March
Snow Depths & Temps
2017
Current Snowpack:
Percent of Average for
March 1.
N Sierra: 159%
Cen. Sierra: 191%
S Sierra: 201%
Ca State: 185%
2017
2016
Snotel Station Reports Current Snow Depth
Carson Pass
47 & 26 degrees, 64"
Ebbetts Pass
49 & 30 degrees, 58"
Sonora Pass
48 & 30 degrees, 50''
Tuolumne Meadows
23 & 53 degrees, 43"
February of 2016
|
2 MARCH 2020
Clearing
Weak Low Passing
across
North Sierra
Warm Day
WIND ADVISORIES
2020
Snowpack:
Percent of Average for
March 2.
N Sierra: 47%
-4% in 5 days
Cen. Sierra: 44%
−2% in 5 days
S Sierra: 39%
−4% in 5 days
Ca State: 44%
−3% in 5 days
Last Reading
Feb 26
Next Reading
March 2
Statewide Summary of Snow Water Content PDF
Station Reports
The
THIRTEENTH
--WINTER--
Temp-Snow
Check
March 2
2020
11 AM - 11 AM
Below: Watershed Snow Water Content Charts followed by individual reporting station's Snow Depth and 24 hour high-low temps.
Last Report:
Feb 27
Next Report:
March 8
Tahoe Basin
Watershed
Southwest Tahoe
Trail Map with Stations
PCT-TYT-TRT
Rubicon 38.0 +8.00
(13.80) + 0.40
7618 feet
Trail Map
29 & 19 −/−
PCT-TYT-TRT
Echo Peak 45.0 +6
(22.00) + 0.40
7652 feet
Stations Map
28 & 19 −/−
American-Yuba Watersheds
PCT-TYT
Carson Pass
44.0 +4
(15.80) +0.20
8388 feet
Trail Map
Stations Map
34 & 14 −/−
Carson-Walker
Watersheds
PCT-TYT
Ebbetts Pass
47.0 +8
(21.6) +0.50
8660 feet
Trail Map
24 & 13 −/−
West of PCT
Highlands Meadow
5.86 −0.7
(19.76) −0.71
8360 feet
Trail Map
21 & 12 −/−
Top of List
EAST FLANK
Leavitt Lake
70.0 +13.0
(17.30) +0.70
9602 feet, East Flank
Trail Map
19 & 8 −/−
EAST FLANK
Marine Base
Cold Weather Training
6748 feet East Flank
Trail Map Above
FULL REPORT
VIS-CHIL-WEA-MB-
WIND
31 & 22 −/+
Mokelumne-Stanislaus Watersheds
PCT-TYT
Sonora Pass
Kennedy Meadows
RESUPPLY
Deadman Creek
27.23 +4.35
(--.--)
9250 feet,West Flank,
Trail Map
19 & 7 −/−
Tuolumne-Merced
Watersheds
SW of TYT
Horse Meadow
Error =0.4 ???
8602 feet
Trail Map
26 & 13 −/−
Top of List
Tenaya Lake
35.47 +4.33
(4.61) + 0.01
8163 feet, West Flank
Trail Map
34 & 16 −/−
JMT-PCT-TYT
Tuolumne Meadows
20.04 +2.39
(4.06) +0.01
8600 feet, West Flank
Trail Map
31 & 13 −/−
Tioga Pass/Dana
ERROR +ERROR
(1.71) =0.00 ??
9798 feet
Trail Map
22 & 4 −/−
Mammoth Mountain
Mono Lake-Owens Basin
East of PCT-JMT
Above Gem Lake
Gem Pass
(error)
10750 feet
Trail Map
temps bad
JMT-PCT Junction
Devils Postpile
8.37 +8.37
(8.95) +0.30
8004 feet
Trail Map Above
30 & 16 −/−
NE of JMT-PCT
Mammoth Pass
52.02 +12.95
(0.64) = +.64
9500 feet
Trail Map
22 & 7 −/−
Top of List
JMT-PCT
E of Bear Ridge
Volcanic Knob
33.80 +1.1
(0.00) = ??
10100 feet
Trail Map
28 & 11 −/−
East Flank
South Lake Cabin
no snow sensor
(29.20) +0.1
9580 feet, East Flank
Trail Map
39 & 3 −/−
East Flank
Big Pine Sawmill
17.60 +1.6
10200 feet, East Flank
Trail Map Above
25 & 0 −/−
Kings River
Just East JMT-PCT
Bishop Pass (bad)
(0.0) =
11972 feet
Trail Map Above
-- & -- −/− (earlier)
Just West JMT-PCT
Charlotte Lake
xx.xx −ERROR?-
(73.03) +0.31
10398 feet, West Flank
Trail Map
23 & 9 −/−
(Typically the coldest station)
Kern Watershed
JMT-PCT
Upr Tyndall Creek
36.15 +2.46
11441 feet
Trail Map
20 & 3 −/−
JMT
Crabtree Meadow
xx.xx ERROR −X.XX
(34.03) −0.04
10,700 feet
Trail Map
26 & 11 −/−
? = questionable data
All High Sierra
Reporting Stations
More Stations, by Watersheds
Top of List
2018, Start o March
Snow Depths & Temps
|
3 MARCH 2020
Clear & Warm
Summer-Like
WARMTH
Deep Snow in the Mountains, Spring on the Horizon...
I'm Pumped. Am I ready?
I Want Skittles!
Navigation
&
Snow
Mountain Safety
AVALANCHE DANGERS
Winter Backpacking
Considerations
BEST
FORECASTS
HAZARDS
Precipitation
General
Quantitative Precipitation Forecasts:
ALL
RAIN FORECASTS
&
MODELS
Direct to
Seven Day Precip
Animation
Precipitation
Geographic
All High Sierra
ZONE & POINT
FORECASTS
All High Sierra
ZONE
FORECASTS
Now
RADAR
SATELLITES
Direct
to
GRAPHICAL INTERFACE
Forecast
Winds? Weather?
NorCal Graphics
Region, SW US
Forecast
Temperatures
Model
Five Day Mean
Low Temps
Click Green "Latest" Model,
observe using step button
All Temps
Let's look at the
Big Picture
Surface Map
The Pacific Ocean
US Weather Map
All Maps |
4 MARCH 2020
Clear & Warm
Summer-Like
WARMTH
Seven Day
Freezing Temperatures
Probability Model
Point
Forecasts
Lake Tahoe Forecast
Walker Forecast
Sonora Pass Forecast
Cherry Lake Forecast
Lee Vining Forecast
Tuolumne Meadows
Mammoth Pass
Lake Thomas Edison
Mount Whitney-Lone Pine
Lake Isabella Forecast
Move the Map Dot
to
Customize Forecast Point
Trail Maps
2018, Start o March
Snow Depths & Temps
This Week
TOP
This Week
TOP
This Week
TOP |
5 MARCH 2020
Tropical
Transport
Mechanisms
"Atmospheric Rivers"
About
TTMs
Tropical Transport Mechanisms
TTM
FORECASTS
Seven Day TTM Landfall
2018
Snowpack:
Percent of Average for
March 5.
(Change since Feb 1.)
N Sierra: 30%
(+10%)
Cen. Sierra: 43%
(+16%)
S Sierra: 37%
(+15%)
Ca State: 37%
(+13%)
2018 |
6 MARCH 2020
DROUGHT
CONSIDERATIONS
Informative
"Normal" Vs. Now
Forcasts & Reality
vs.
Averages
HIGH SIERRA
SNOW INFO
All Snow Info
SNOW STATUS
&
FORECASTS
THE SNOWPACK
GRAPHICS
Date-Adjustable
High Sierra Snowpack Status
NOAA-NOHRSC
The High Sierra
3-2-20 |
7 MARCH 2020
LAST WEEK
NEXT MONTH
Top
2019
Current Snowpack:
Percent of Average for
March 7.
N Sierra: 158%
+5% in 3 days
Cen. Sierra: 164%
+5% in 3 days
S Sierra: 161%
+12% in 3 days
Ca State: 161%
+6% in 3 days
Last Reading
March 4
Compare this Winter, first with Feb 3 during the record year of 2017, Above, the first of March, to our left, and
April 1st of 2017,
.
2019
LAST WEEK
NEXT MONTH
Top
LAST WEEK
NEXT MONTH
Top
LAST WEEK
NEXT MONTH
Top |